Ever wondered how much rain we have had? Or if a river is rising or falling? If you look at the stats of the most viewed pages on our website – it seems to be something that interests many in our District.
Well, that’s exactly the sort of information that our Environmental Monitoring team provides. Not only all things rain or river, but also groundwater levels, water quality and sea level data.
They are a team of science technicians, who collect data from our Environmental Monitoring Network that includes 26 river sites, 44 rain gauges and 57 groundwater sites across the region.
They also sample river water quality and groundwater quality, and monitor sea level and air quality. They strive for high-quality environmental data.
Some of the river stations have been recording since the early 1950s, and the region’s database includes rainfall data back as far as the 1920s. The trends and cycles captured within this data set are highly valuable and they aim to maintain the scientific record for generations to come.
The information they collect during the summer is used to make decisions for water allocation, industry supply, future water resource information and of course support river health.
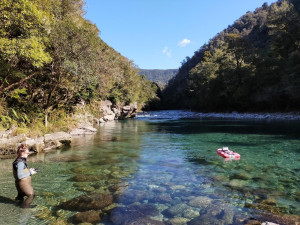
Not only do they monitor our waterways as a resource, but they also monitor for recreation, enabling people to know where the safe places are to swim during the hot summer months.
On the other end of the scale, their maintenance of this environmental monitoring network ensures real-time flood flow and rainfall data are available to the community and Council to make good decisions during a flood event in the interest of public safety and asset management.